.BwweyAj6_ZJlM9M.webp)
E-commerce metrics are now available in User Analytics!
We bring you the latest updates for Amethyst.
E-commerce metrics are now available in User Analytics
User Analytics project settings now let you choose whether to show e-commerce metrics.
In the E-commerce site setting, select Yes — show e-commerce metrics to make revenue, transaction count, purchase rate, average order value, refund value, items purchased, and other metrics available in User Analytics tables.
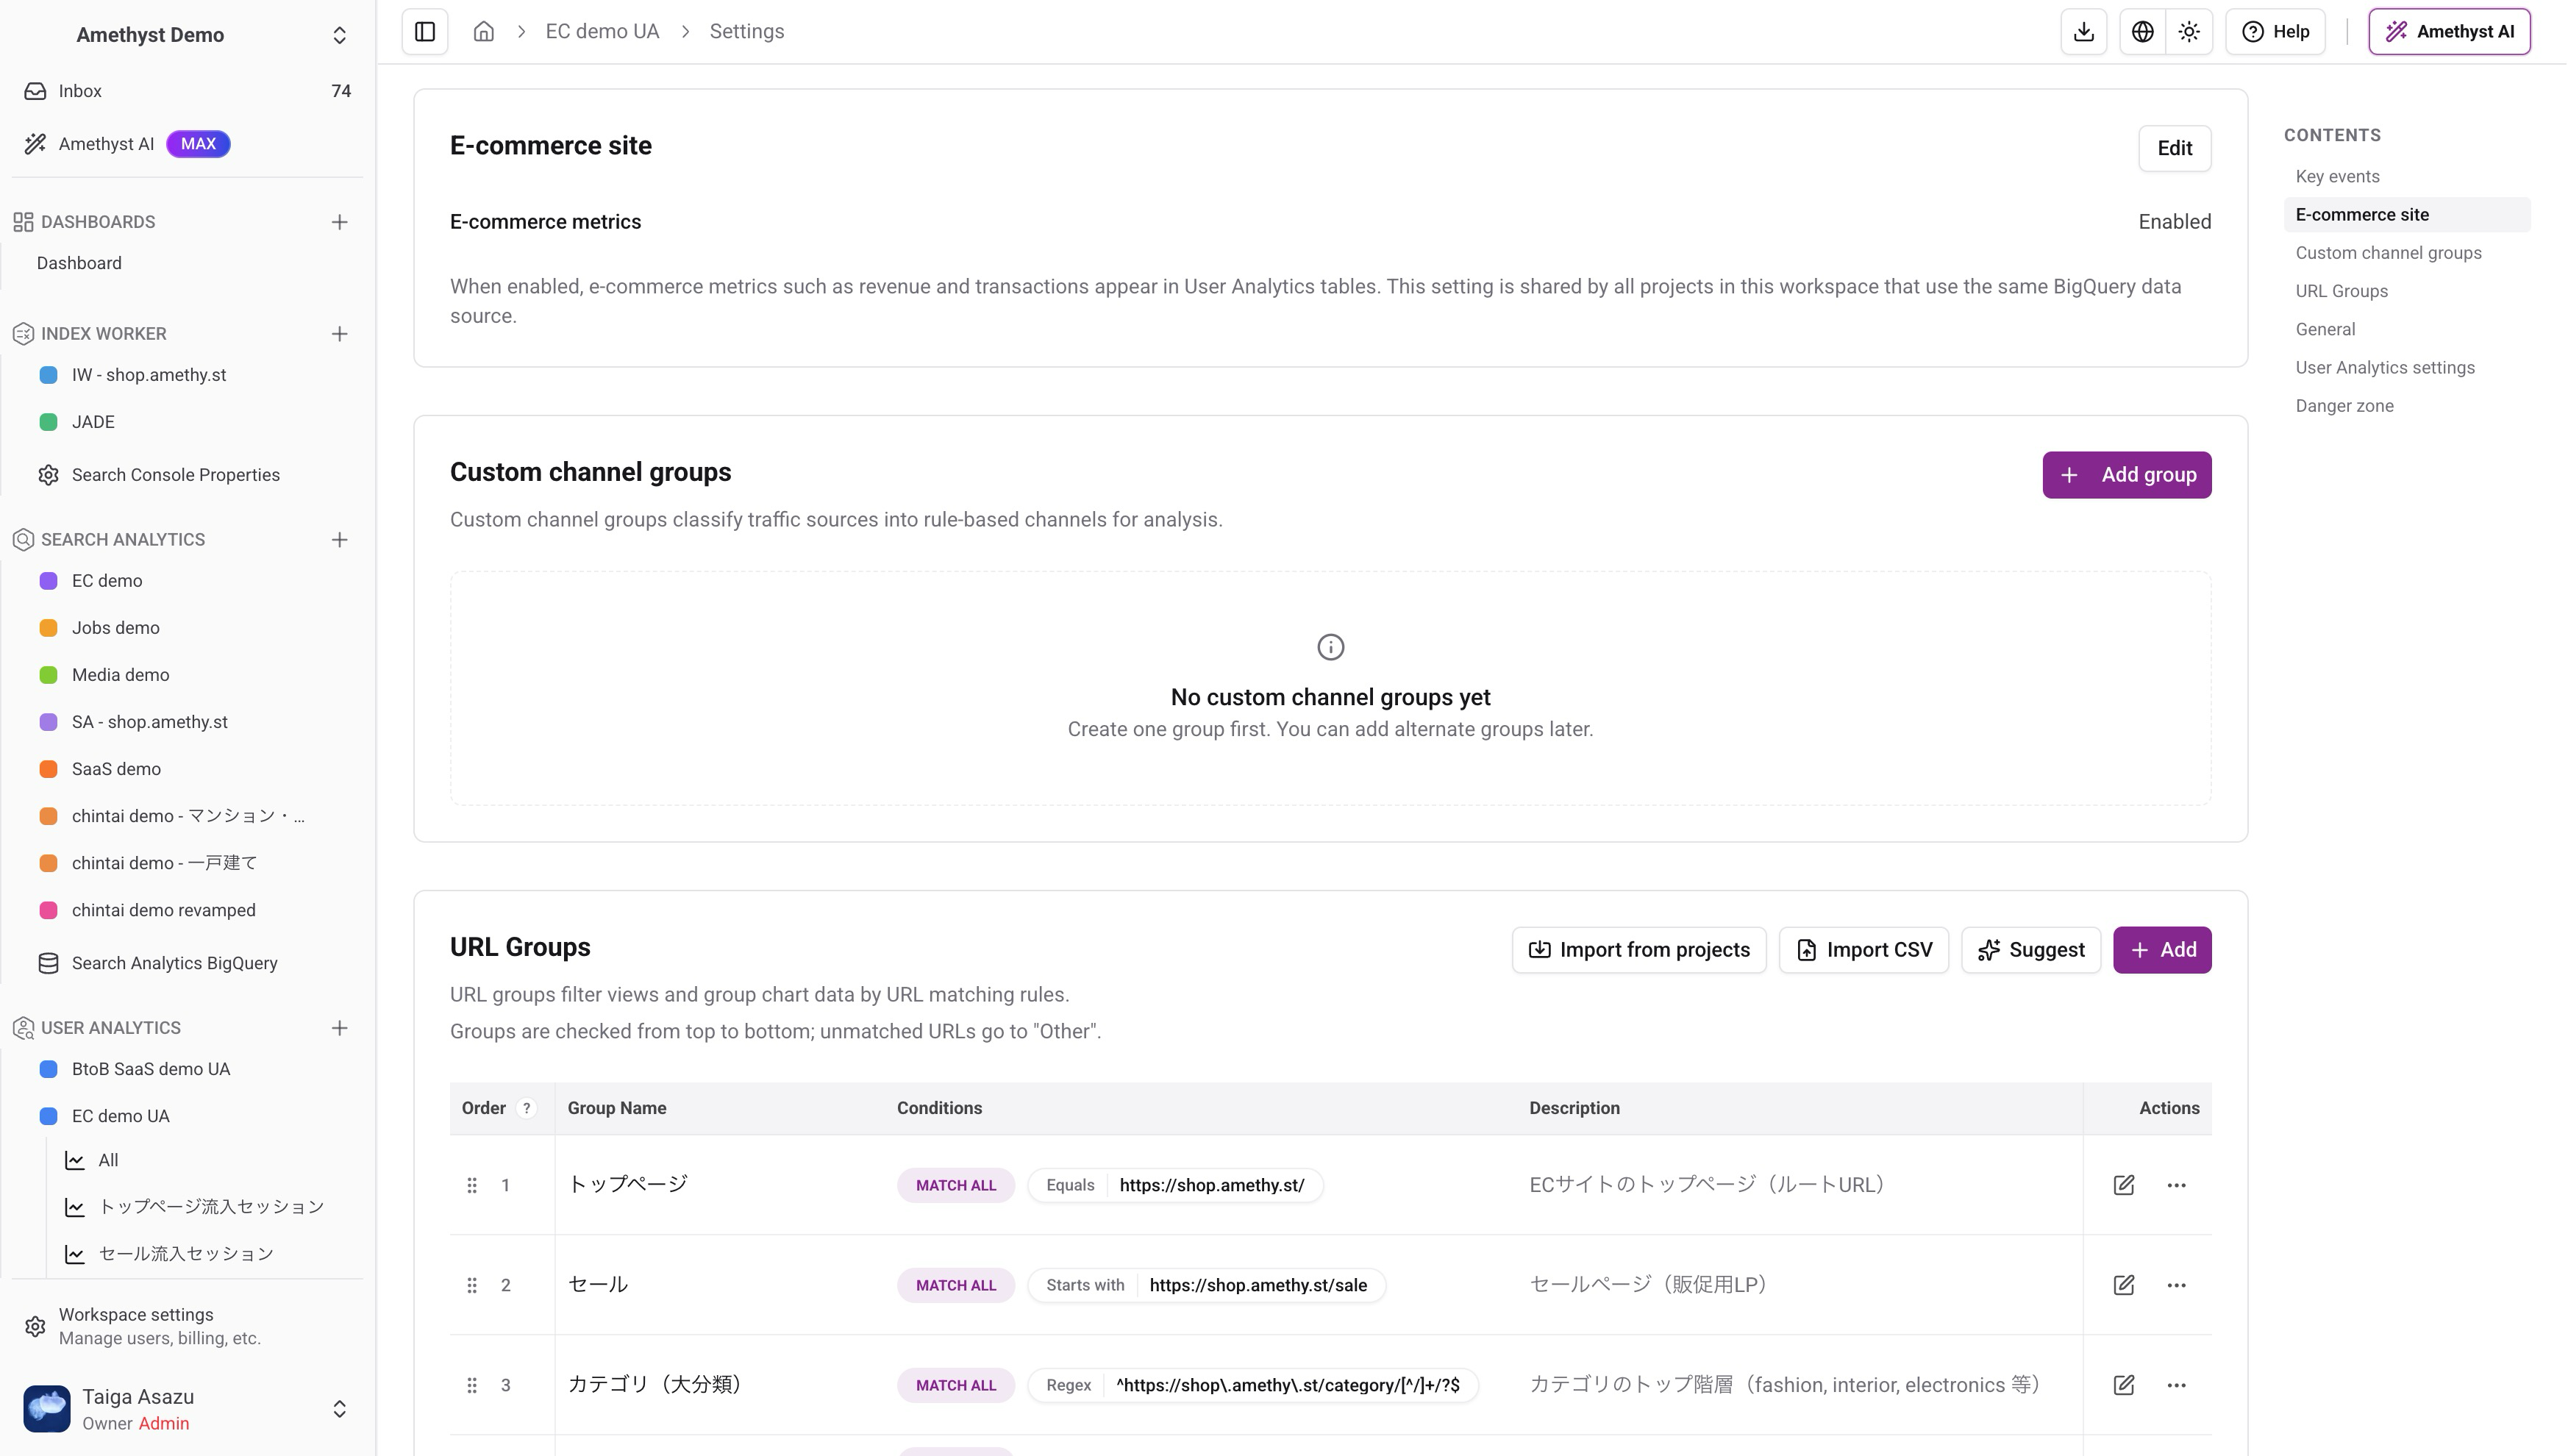
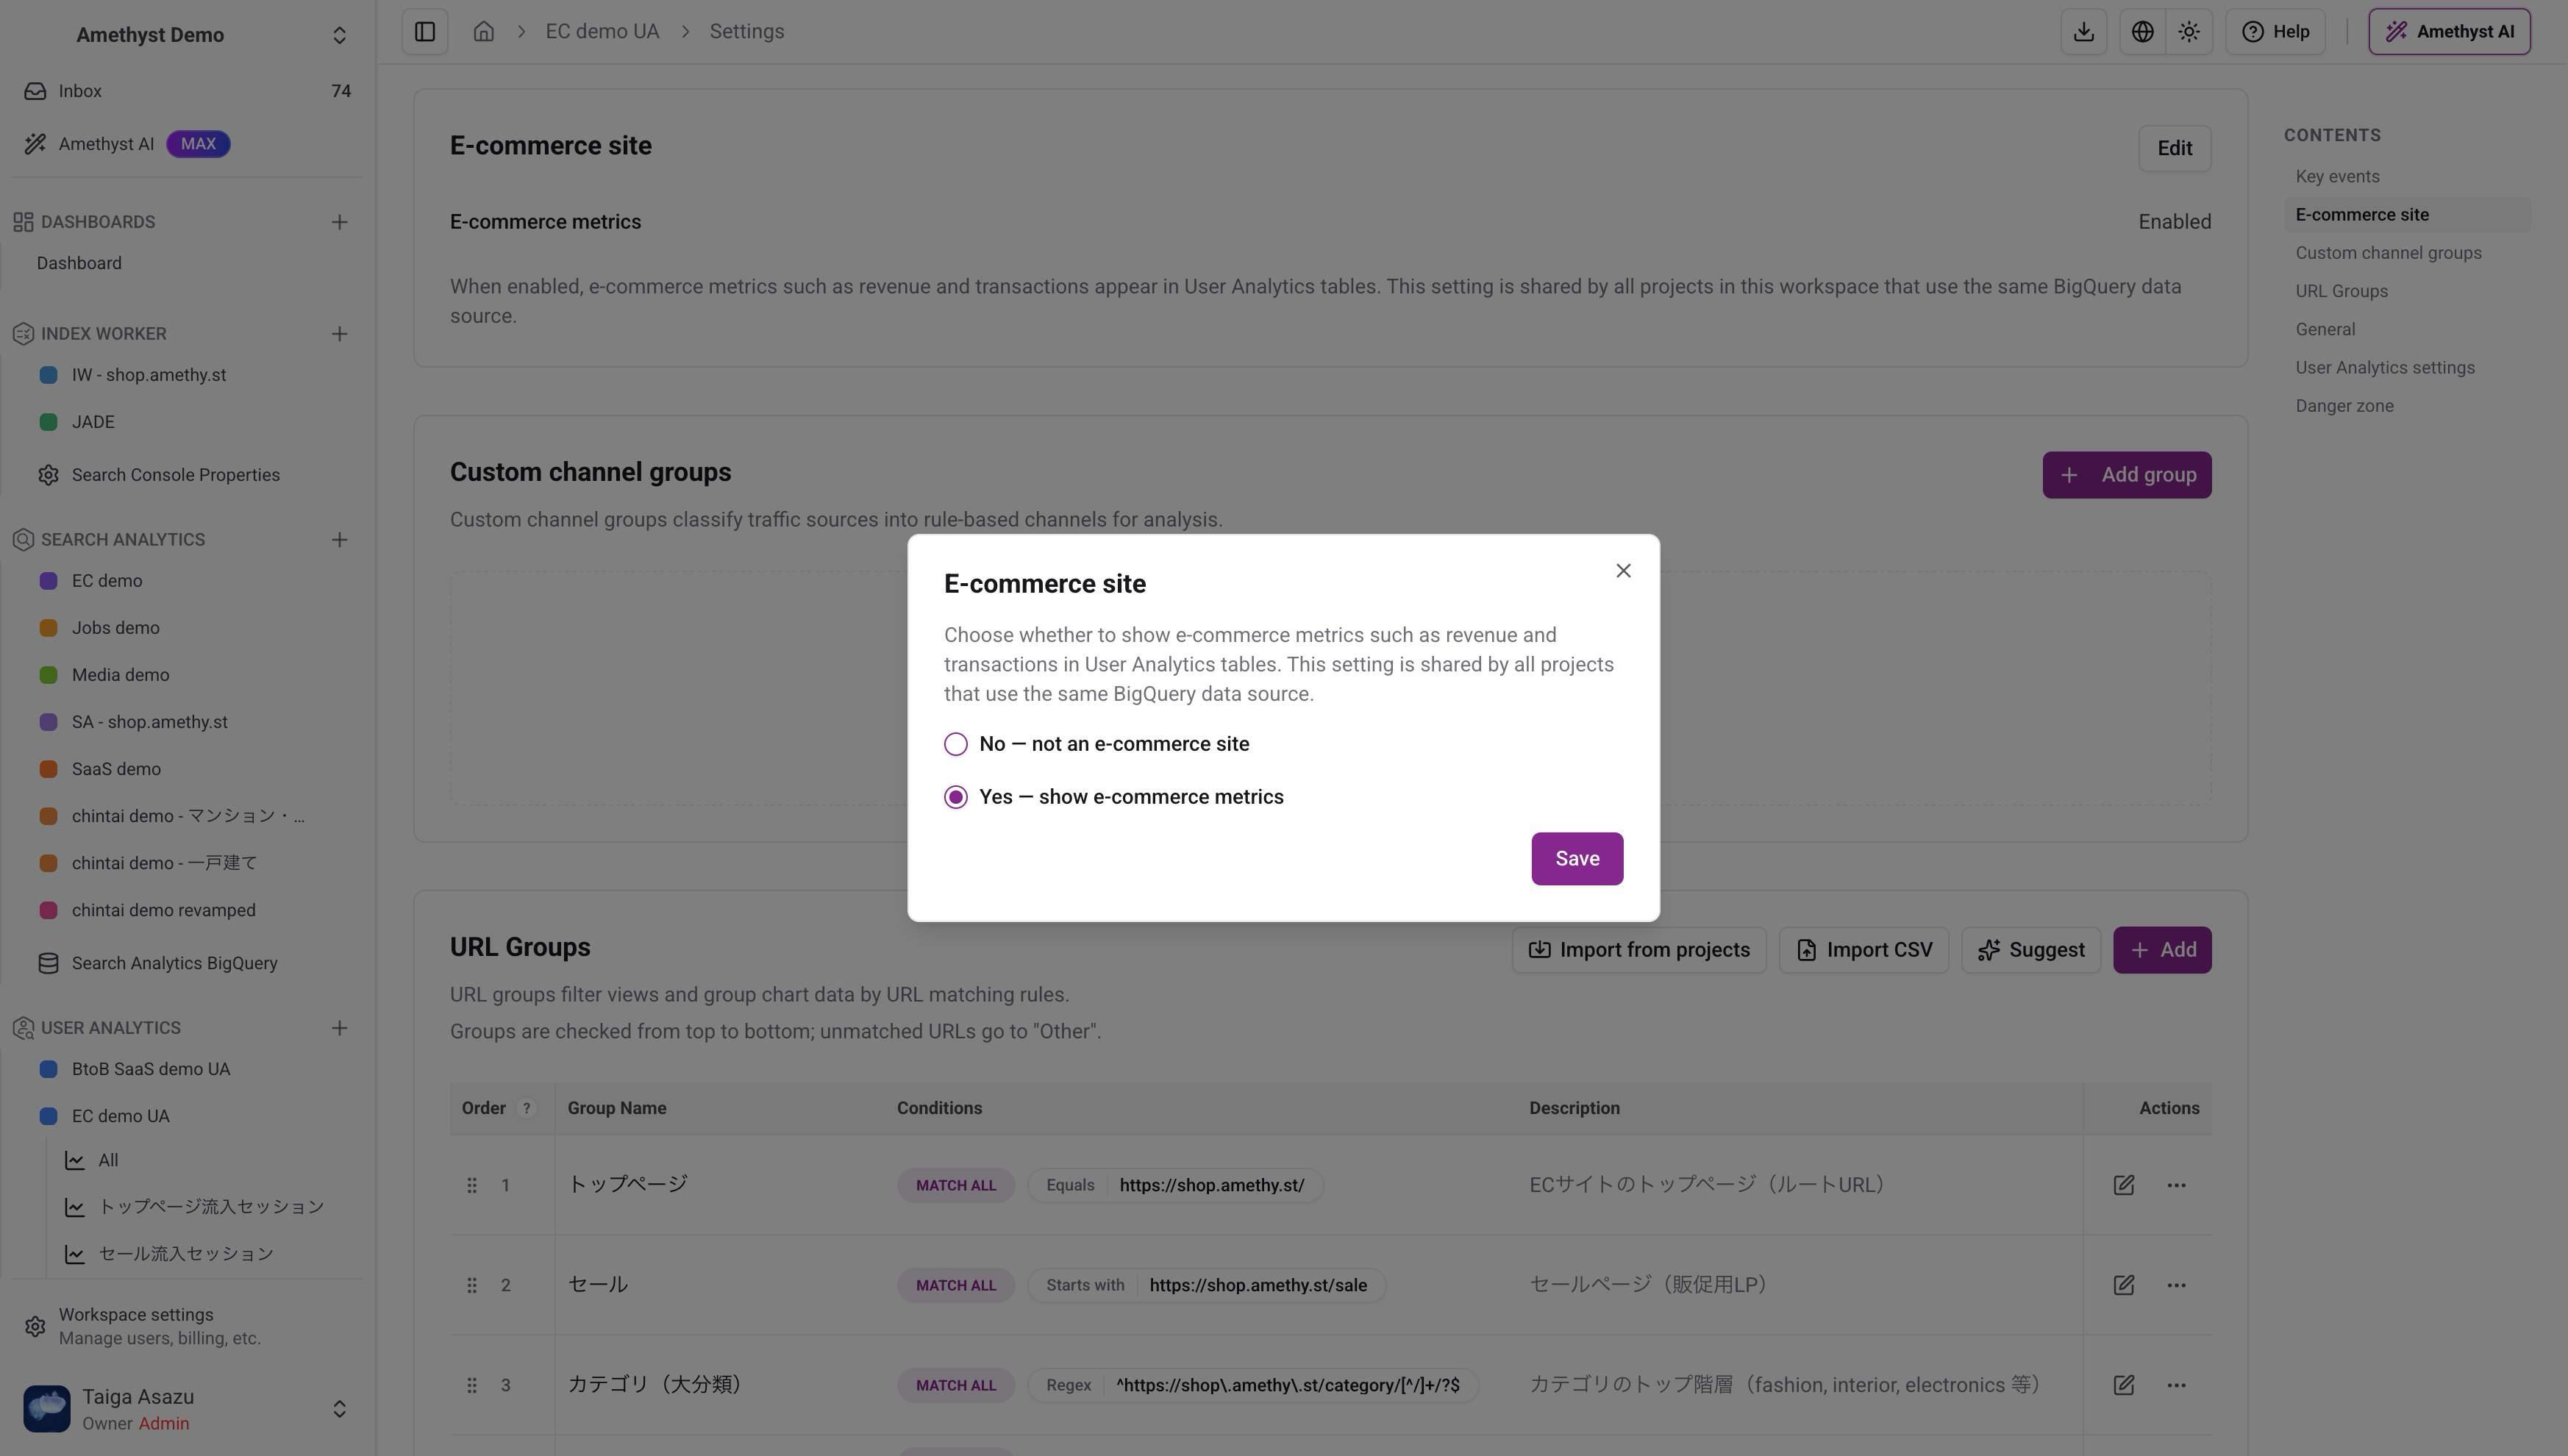
When enabled, data preparation for e-commerce metrics runs in the background. Once preparation completes, the metrics can be reviewed in detail tables, comparison views, exports, and AI tools. This setting is shared by projects that use the same BigQuery data source.
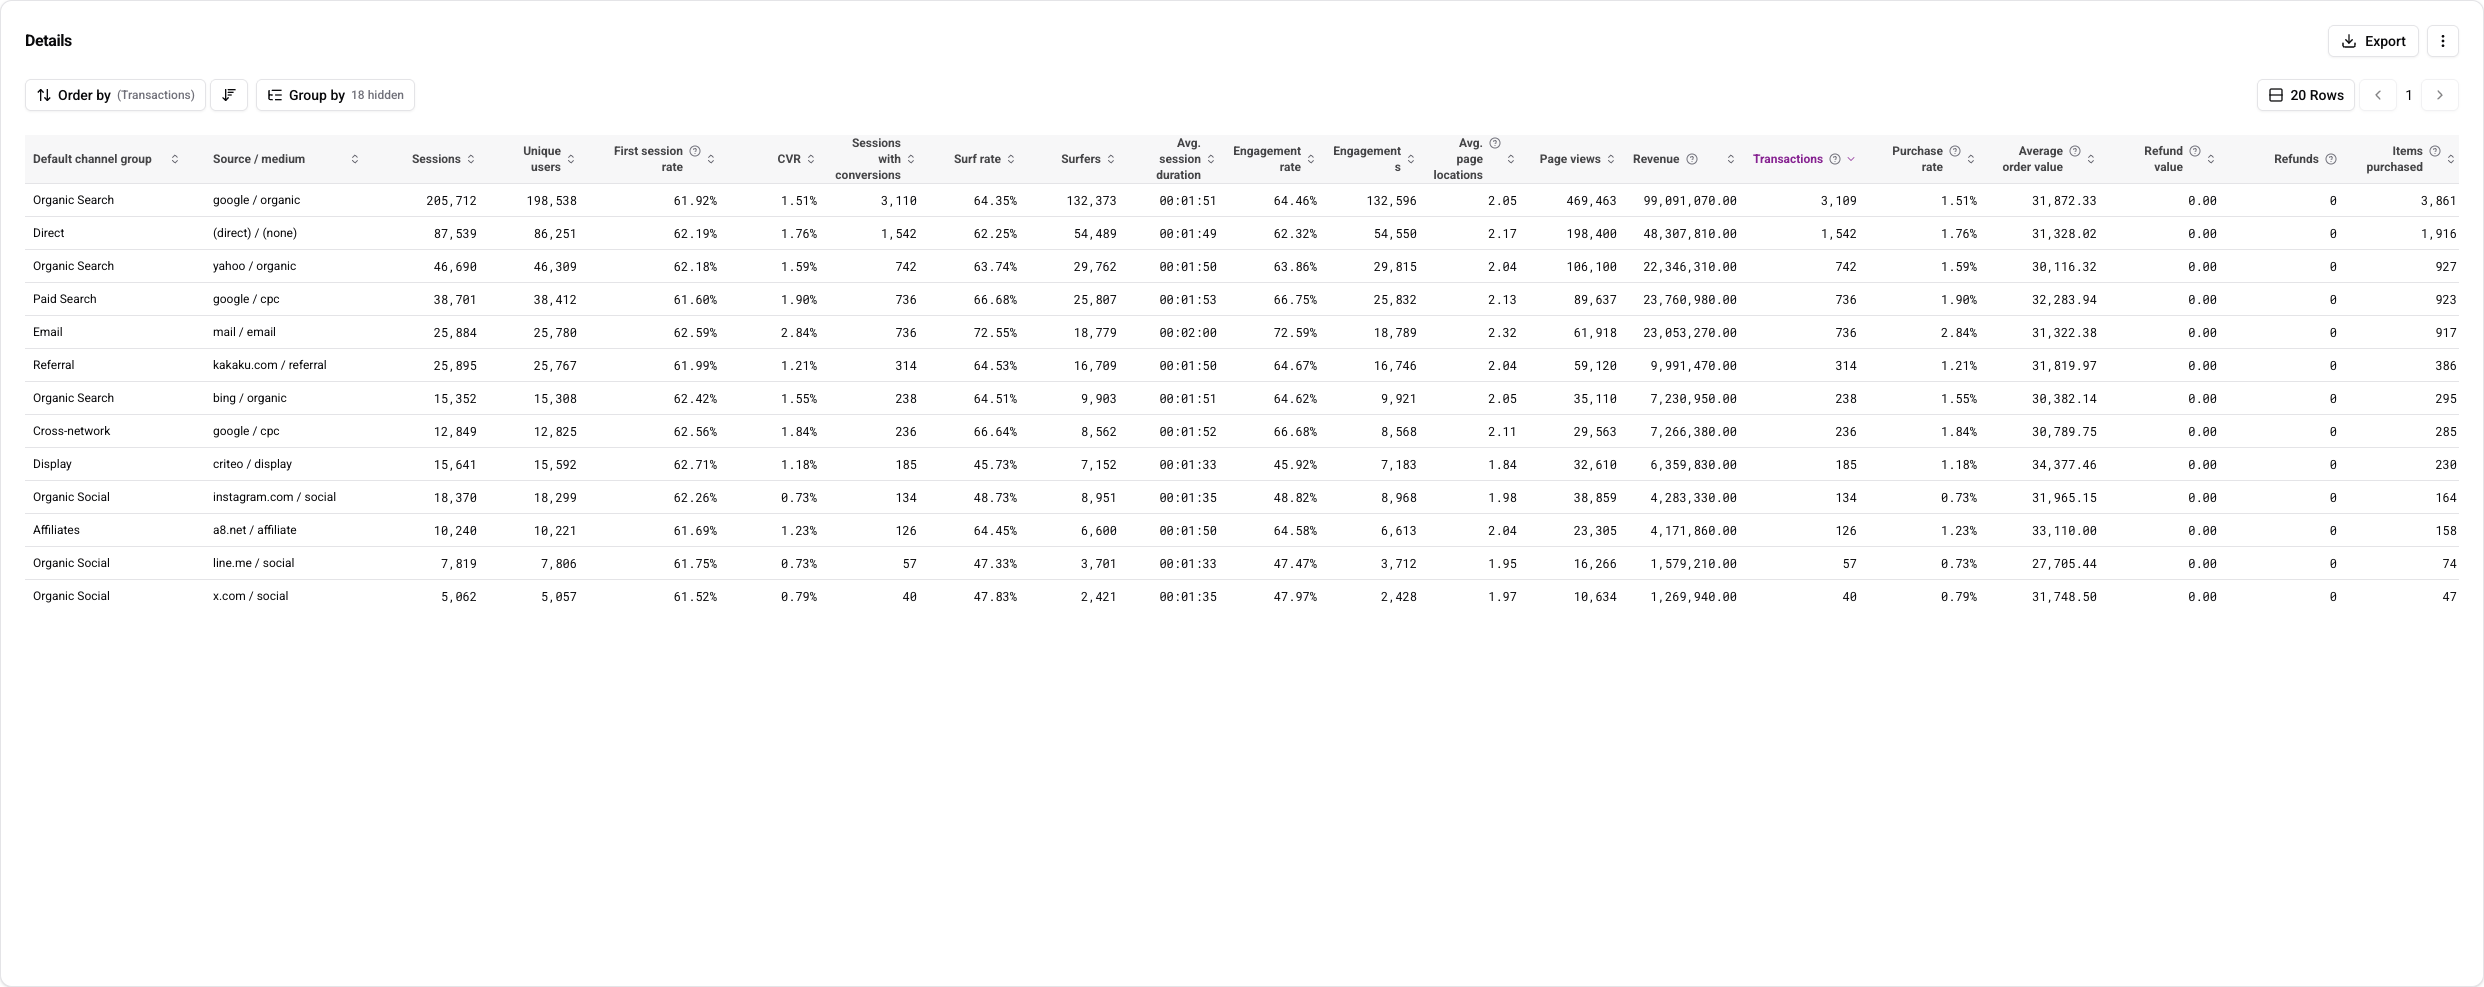
This makes it easier to analyze which landing pages, traffic sources, campaigns, or regions are driving purchases, and whether average order value or refund trends differ by segment. By reviewing revenue together with transactions and purchase rate, you can separate traffic volume issues from purchase efficiency issues.
E-commerce metrics are currently focused on detail tables and comparison views. Chart support is planned for a future update.
Minor Changes
Improvements
- User Analytics session details can now be grouped by country, region, and city.
- The project color picker now shows colors already used in the same workspace as candidates.
- Guidance shown when deleting a Search Console property has been improved so the next action is clearer.
- Search Analytics now makes provisional latest-day data easier to distinguish from stable data.
Bug Fixes
- Fixed an issue where users could be redirected to a different workspace instead of returning to the last workspace after login.
- Fixed an issue where Search Analytics derived views could fail to handle the GA4
event_datecorrectly.